Degree Outcomes Statement 2022/2023 data
October 2024

Authors:
Daniel Baker (lead author), Stephen Gow, Adrian Lee, Vanessa Richardson-Pratt, Jen Wotherspoon, Jess Burchell and Patrick Gallimore.
Notes and Documents:
- Summary of 23/24 progression and award rules
- UKSCQA statement regarding Degree Outcomes Statements
- The UKSCQA Document on Statements of Intent
- The QAA Guidance Document for Universities preparing DOSs
- The QAA Checklist for Universities preparing DOSs
Analysis of degree outcomes
The University undertakes an annual analysis of degree outcomes, with one of the metrics being the percentage of upper-classification (UC) degrees (ie first-class or upper-second-class) along with an analysis of sector trends, using HESA data. We also undertake regular detailed analyses of the correlation between student demographics and outcomes (eg attainment and progression).
A data-visualisation tool provides an interactive analysis of how degree outcomes vary over time, by graduating year, and of any correlation with the A-level (or equivalent) entry grades and other demographics, for that graduating cohort. Using these tools, and other data, we have analysed the last eight years of graduating cohorts (2015/16-2022/23). We present data for the 2022/23 graduating cohort, as these data are fully available at time of writing. In line with UKSCQA guidance, the analysis is focused on the percentage of Level 6 (H-level, Bachelor) graduates who were awarded an upper-classification (UC) degree (ie first-class or upper-second-class) of all Level 6 graduates awarded an applicable classification.
This means data do not include any Integrated Masters undergraduate awards, and all our Sciences departments have such awards. %UC trends over the last eight years are shown in Figure 1.
Considering data across all subjects, the percentage of graduates awarded UC degrees (which we refer to as %UC) saw a clear and significant decrease in 2023, following a period of increase during the pandemic. A similar pattern has been observed across the sector, and is attributable to the impact of pandemic-related changes to award rules (see next section). %UC for the University of York remains substantially below the median for other Russell Group universities (York: 78.9, RG: 85.2), below the pre-pandemic Russell Group median (86.3 in 2018/19) and is now below our own pre-pandemic level. Data for the whole sector show a similar pattern (76.1 in 2022/23, down from a high of 81.8 in 2020/21, and close to the pre-pandemic value of 75.6 in 2018/19).
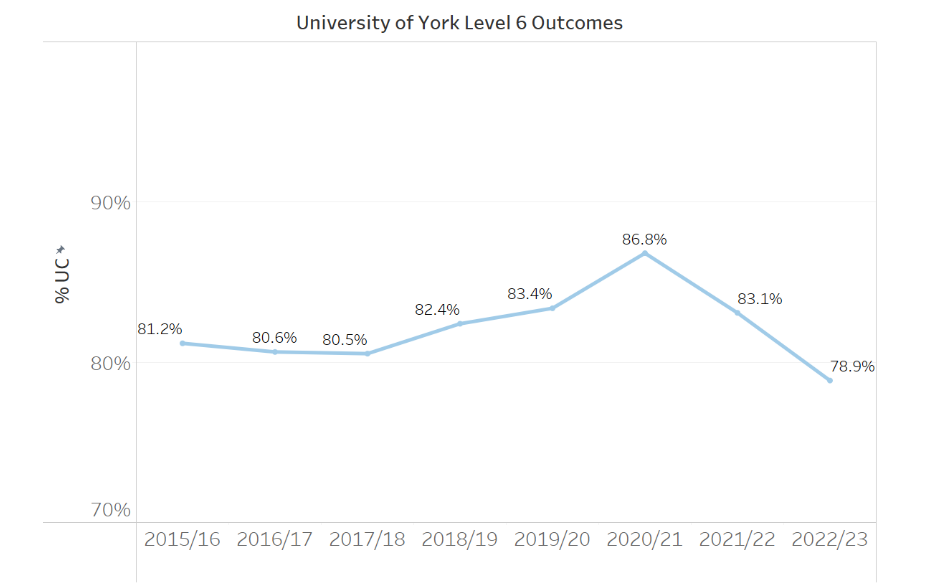
Figure 1: Data for the percentage of applicable students who graduated from the University of York with either a first-class or upper-second-class honours degree (%UC) against academic year of graduation
Impact of Covid-19
Some students graduating in 2022/23 were affected by the Covid-19 pandemic in a number of ways, including greater use than under normal circumstances of remote teaching and learning and of online assessments in place of closed examinations.
Some changes to the award and progression rules were applied for those for whom studies in 2020/21 counted towards their final degree calculation (eg students that had taken a leave of absence, taken a year abroad or in industry), which were designed to support students in this time of unprecedented change and recognise the challenges that our students have faced throughout their studies. Where applicable, the algorithm for determining final degree class in 2023 was adjusted so that two alternative weightings were considered when calculating the award mark for level 6 graduates (Bachelors).
The first was the standard weighting (2:3), and the second (a 1:3 weighting) reduced the contribution of marks from 2021 by 50%. Students’ award marks were calculated using the better of the two weightings.
This measure was intended to compensate for disruption due to the pandemic, and we believe it will have had a slight inflationary effect on overall degree classification for those 2022/23 graduates whose 2020/21 studies contributed towards their final degree.
However, the pandemic compensation in 2023 was less substantial overall than for students graduating in 2021/22 and 2020/21, who also benefited from a ‘safety net’ process on their grades from 2019/20 and 2020/21. Relative to the 2020/21 graduating cohort, there was a decrease of 3.7% in 2021/22 and a further decrease of 4.2% in 2022/23, to below our pre-pandemic %UC figure, which we attribute to this reduction in pandemic mitigations.
Award gap
We are strongly focused on identifying and narrowing award gaps of upper classification degrees for disadvantaged groups. Our Access and Participation Plan (APP) web pages provide an overview of our approach and links to our 2020/21-2024/25 APP and our new 2025/26-2028/29 APP. The published plans contain data on award gaps compared with students’ more advantaged peers (for undergraduate home students only) and provide details of the actions we are currently taking, and plan to take to address these gaps. The following data can be found and analysed in more detail on the Office for Students Access andParticipation Dashboard.
For Mature students, the award gap has reduced the most of all the primary APP characteristics, moving from a -13.3pp gap in 2021/22 to a -6.0pp gap - a decrease of 7.3pp. The two largest award gaps are both in Ethnicity, where Black students have a -25.5pp award gap (compared to White students) in 2022/23 compared to -16.6pp in 2017/18 (an increase of 8.9pp). The next largest awarding gap is for students from Other ethnic groups (ie not classified as Asian, Black, Mixed or White). Other ethnic groups have an awarding gap of -20.0pp; there are no historical trends as 2022/23 is the first year in which Other ethnic groups have had a gap calculated.
For Asian students, they saw a reduced award gap from 2017/18 to 2022/23, decreasing by 1.5pp, but still experienced a large award gap (-14.2pp in 2017/18 compared with -12.7pp in 2022/23). The third largest award gap is for socio-economically disadvantaged students (IMD quintile 1) -18.9pp gap in 2022/23 compared with -10.6pp gap in 2017/18 (an increase of 8.3pp over the last six years, and an increase of 1.1pp compared to 2021/22). Students with a registered disability have the smallest award gap at just 0.4pp, a decrease of 4.2pp from 2021/22 and 0.7pp below the 2017/18 awarding gap.
OfS Analysis of Degree Classifications
In conjunction with the publication of the 2022/23 Award gap data, the OfS published an updated analysis of degree classifications over time. This analysis is framed within the context of the OfS’ concerns around ‘grade inflation’ and the unexplained increase in firsts and 2.1s being awarded by universities in England (defined as changes in the characteristics of the graduating cohort included in OfS modelling that cannot explain statistically the changes in attainment over the period).
From the first year of this analysis (2010/11) to 2022/23 York has experienced the joint-second smallest amount of unexplained grade inflation in the Russell Group at 3.4pp, with the lowest only 0.7pp lower. York’s 3.4pp unexplained is far lower than the Russell Group median of 6.7pp and three Russell Group institutions have 10.0pp or more UC awards unexplained. The median unexplained grade inflation across the sector is 11.9pp, with York being in the lowest decile for grade inflation compared to the sector.
During Covid-impacted years York’s unexplained variance peaked at 11.4pp in 2020/21 which was at the Russell Group median. In the years prior to Covid, York’s unexplained grade inflation was consistently towards the lower end of the Russell Group and was always below the Russell Group median, and also considerably below the sector median.
Assessment and marking practices
The University of York has well-developed processes for ensuring that assessment activities and criteria are in line with national expectations and published sector reference points. Our programme approval processes (including those for partner’s provision the University validates) ensure that Programme Learning Outcomes are aligned with the Sector Recognised Standards for qualification descriptors, and programme design is informed by the relevant QAA Subject Benchmark Statement and Professional, Statutory or Regulatory Bodies. All new programme proposals are evaluated by an external assessor.
University Assessment Policies and Procedures articulate the principles and policies for assessment, standards, marking and feedback. Schools/departments and validated partners are responsible for the development of assessment and marking criteria that adhere to these principles. Devolution to subject areas ensures that choice of assessment formats, assessment criteria and marking practices are informed by external reference points and reflect discipline-specific expectations.
External Examiners oversee all taught provision that leads to the award of credit or a qualification of the University (including validated provision). They are recruited following a robust process aligned with the principles defined by the UK Quality Code, with appointments approved by the Standing Committee on Assessment. An Institutional External Examiner also provides additional, high-level insight and oversight to ensure management of standards is comparable in the sector. In the last five years of this review period, the vast majority of External Examiner reports confirmed, for all undergraduate programmes, that (i) standards set are appropriate for the qualification; (ii) academic standards and the achievements of students are comparable with similar programmes in other UK institutions; (iii) processes for assessment, examination and the determination of awards followed policy and were fairly conducted. Where examiners raised concerns, these issues were reviewed and appropriate actions taken to secure standards.
Academic governance
Responsibility for the assurance of standards of taught provision resides with a Senate Committee; University Teaching Committee (UTC) which is chaired by the Pro Vice-Chancellor for Teaching, Learning and Students and includes Student Representatives. The Standing Committee on Assessment (SCA), a sub-committee of UTC, is responsible for the monitoring and review of policies and procedures relating to assessments, marking, feedback and progression, and for the approval of External Examiners. An External Examiner summary report, which identifies University-wide issues and common themes arising from External Examiners’ annual reports, is considered by SCA and UTC; this ensures robust oversight of institution-wide and substantive issues relating to assessment, marking and standards. The Institutional External Examiner also provides a high-level overview, including review of this statement, to inform UTC.
Analyses of undergraduate and taught postgraduate degree classification distributions are considered by UTC and SCA annually; degree outcomes data is also considered annually by schools/ departments as part of our annual monitoring and review processes.
All Hull York Medical School (HYMS) programmes are awarded jointly by the Universities of Hull and York; a distinct quality and standards framework, overseen by the HYMS Joint Senate Committee. The processes for securing standards and for the assurance and enhancement of quality are comparable to those articulated within the Degree Outcomes Statements of the Universities of Hull and York.
The University validates the Bachelors degrees designed and delivered by CITY College, the University of York Europe Campus. CITY College leaders are members of Senate, UTC and SCA and joint learning and teaching committees. Subject contacts from University cognate departments and regular monitoring and evaluation exercises ensure the comparability of quality and standards of programmes delivered at CITY College. The first bachelors students graduated in 2024 and outcomes data will be included in future statements.
Classification algorithms
The University of York has a single undergraduate modular framework for all undergraduate awards, which provides a single set of progression, award and classification regulations. All Bachelors (Level 6) degrees are classified using the same, single, algorithm which is based on a weighted average of all marks obtained in modules in the final two years of study. The definitive list of progression, award and classification regulations can be found in the University Assessment Policies and Procedures. In addition, we publish Student Guides to the same regulations. These documents summarise the rules on progression, compensation, reassessment, award and degree classification, including the rules for borderline cases.
For the period covered by this statement, other than the temporary changes introduced in 2020, 2021 and 2022 during the Covid-19 pandemic (see above), the only substantive modification made to the award rules since 2010 is a reduction in the minimum module mark required to allow compensation in the final year of study, a change which reduced the number of final-year resits (2017-2023 graduates). It should be noted that degree classification to 2022/23 has been based on first-attempt module marks, not the marks after resit. An analysis of outcomes was undertaken after two years of operation of this amended rule and, of the small number of graduating students affected by the change, the majority did not obtain upper classification awards. It should be noted that the University has undertaken a review of the progression and award rules, which implemented changes from the academic year 23/24.
Teaching practices and learning resources
In 2023, the institution proudly achieved a Gold award in the Teaching Excellence and Student Outcomes Framework (TEF) demonstrating delivery of consistently outstanding teaching, learning and outcomes for our students. The past decade has seen a series of learning and teaching strategic initiatives each designed to secure standards and assurance, and enhance the quality of the student experience. In recent years, inclusive learning projects have been prioritised to support all students, such as student-led learning communities projects, Peer Assisted Learning and the Decolonising and diversifying the curriculum project.
Other university provision to support student success includes the Writing Centre, Maths Skills Centre, academic integrity resources and a series of online Skills Guides to supplement embedded skills training. All first year students can take part in our York Strengths Programme that supports students in understanding the transferable/core skills graduate employers are looking for, and enables them to explore these using a strengths based approach to understand what they can do and love to do. Our teaching, learning and community spaces are constantly developing and improving. For example, our Law Clinic, Sustainability Clinic, and in the Library our creativity spaces, family room and range of study spaces.
Identifying good practice
We are confident that, as outlined above, our processes for securing standards, and institutional oversight thereof, are robust. In undertaking the work to develop our Degree Outcomes Statement we have enhanced our degree outcomes data sets. Notably we have expanded our suite of Tableau workbooks to include students’ top three A level results; this enhancement allows analysis of how degree outcomes vary over time and any correlation with A level grades.
Areas for further work or review
The University has undertaken a full review of the award and progression rules, implemented from 2023/24. The review was partly motivated by a recent revision of the modular scheme framework, which applied to all programmes from the 2023/24 academic year, along with a shift to a semesterised calendar.
The revised rules will affect awards in 2024 and the analysis of 2023/24 outcomes will reflect this. The University Assessment Policies and Procedures are under review in 2024/25 to improve the student and staff experience of assessment, marking and feedback and to maintain academic standards.
With the first Bachelors graduates in 2024 at CITY College, University of York Europe Campus, our outcomes monitoring, evaluation and reporting activity will also include CITY College graduate data in future statements.