New reports
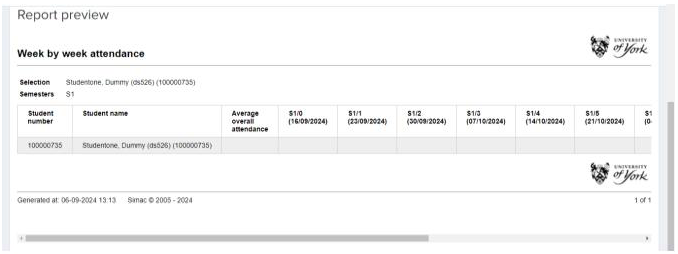
Week-by-Week Attendance
Overview of students and their attendance percentage per week.
As you will see, you can toggle by all three semesters, including the ability to preview and download into Excel. You can search by student or department.


The report will appear as the screenshot below, with percentages appearing each week. To find more data use the scroll bar to move through the selected semester(s). The report is colour coded to identify those with less than 25%, 25-50%, and 50%+.
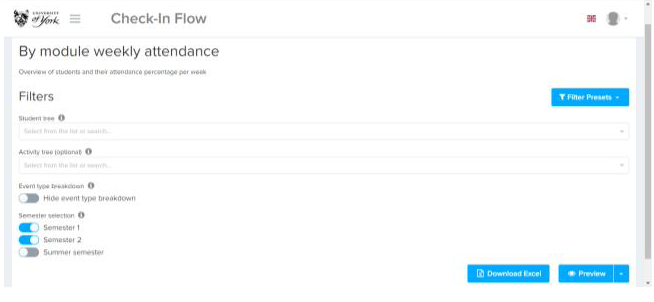
By Module Weekly Attendance
Overview of students and their attendance percentage per week.
Similar to the report above, you can toggle by all three semesters, including the ability to preview and download into Excel.

The report will give you a breakdown of the percentages of activities for the student(s), eg lectures, seminars, workshops, labs, etc. You can also toggle to hide the event type breakdown.
Other updates to reports:
New Toggles
There are new toggles in reports such as Attendance Overview, you can select ‘only show attendance for non-lecture sessions’ or toggle to show only those students who have a Student Support Plan.
Personal Engagement Report
When a report is populated, a summary box will appear that shows breakdowns of modules/codes/type/absent/present and attendance percentage.
Timetable View
Hover over an activity in the timetable view on a Teaching Blocks case to see the Module code and activity name displayed.
Re-assign
Within the block reports, you can reassign cases between colleagues.
Download our quick card for a printable version of these instructions:
