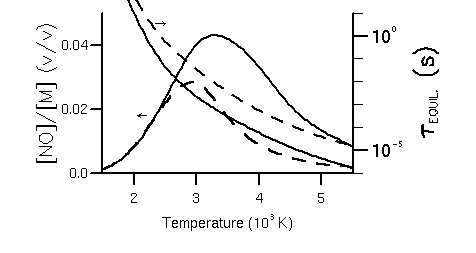

Figure 6. Variation of NO equilibrium mixing ratio and tauequil. with temperature (solid line: 500 mbar, dashed line: 27 mbar). The calculations were made using the NO and NO2 reaction scheme of Hill et al. [1980] and integrated using the SENKIN program [Lutz et al., 1988], with constraints of constant temperature and pressure. tauequil. is defined here as the time for the NO concentration to reach half the equilibrium value.